hi, use matlab2tikz to convert your plot to .tex then you could utilize the xepersian package for the rest, just edit the title, x label and so on with what you want, here is an example.
clc;clear;clf;
pout=100:100:600;
peff_switching=[86.3,85.4,84.9,84.6,84.4,84.2];
peff_pwmPrec=[81.7,82.1,82.4,82.5];
peff_pwsm11l=[87.3,87.5,87.6,87.5,87.4,87.5];
mf3=figure(1)
plot(pout,peff_switching,'-ok','linewidth',0.8);hold on; box off;
plot(pout(1:4),peff_pwmPrec,'-^r','linewidth',0.8);
plot(pout,peff_pwsm11l,'-sb','linewidth',0.8);

Legend={'Switching Amplifier','PWM Amplifier capable of power recovery ','11 Level PWSM Amplifier'};
xlabel('Power output');ylabel('Power efficiency');
legend(Legend,'Location','southeast');
matlab2tikz('figurehandle',mf3,'filename','figeff1.tex' ,'standalone', true,'floatFormat','%.3g')
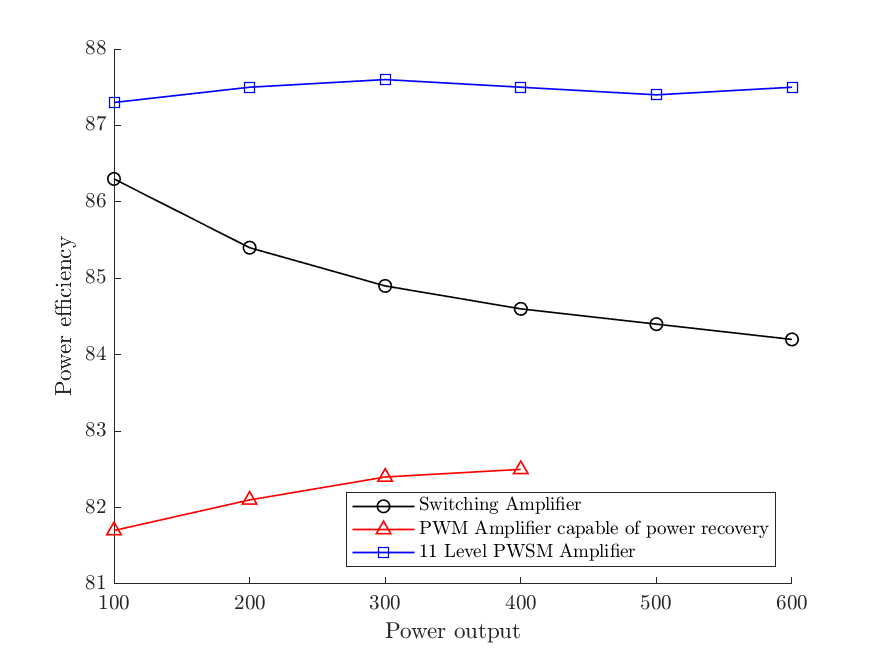
gives us,
% This file was created by matlab2tikz.
%
%The latest updates can be retrieved from
%  http://www.mathworks.com/matlabcentral/fileexchange/22022-matlab2tikz-matlab2tikz
%where you can also make suggestions and rate matlab2tikz.
%
\documentclass[tikz]{standalone}
\usepackage[T1]{fontenc}
\usepackage[utf8]{inputenc}
\usepackage{pgfplots}
\usepackage{grffile}
\pgfplotsset{compat=newest}
\usetikzlibrary{plotmarks}
\usetikzlibrary{arrows.meta}
\usepgfplotslibrary{patchplots}
\usepackage{amsmath}

\begin{document}
\begin{tikzpicture}

\begin{axis}[%
width=4.521in,
height=3.566in,
at={(0.758in,0.481in)},
scale only axis,
xmin=100,
xmax=600,
xlabel style={font=\color{white!15!black}},
xlabel={Power output},
ymin=81,
ymax=88,
ylabel style={font=\color{white!15!black}},
ylabel={Power efficiency},
axis background/.style={fill=white},
axis x line*=bottom,
axis y line*=left,
legend style={at={(0.97,0.03)}, anchor=south east, legend cell align=left, align=left, draw=white!15!black}
]
\addplot [color=black, line width=0.8pt, mark=o, mark options={solid, black}]
  table[row sep=crcr]{%
100	86.3\\
200	85.4\\
300	84.9\\
400	84.6\\
500	84.4\\
600	84.2\\
};
\addlegendentry{Switching Amplifier}

\addplot [color=red, line width=0.8pt, mark=triangle, mark options={solid, red}]
  table[row sep=crcr]{%
100	81.7\\
200	82.1\\
300	82.4\\
400	82.5\\
};
\addlegendentry{PWM Amplifier capable of power recovery}

\addplot [color=blue, line width=0.8pt, mark=square, mark options={solid, blue}]
  table[row sep=crcr]{%
100	87.3\\
200	87.5\\
300	87.6\\
400	87.5\\
500	87.4\\
600	87.5\\
};
\addlegendentry{11 Level PWSM Amplifier}

\end{axis}
\end{tikzpicture}%
\end{document}
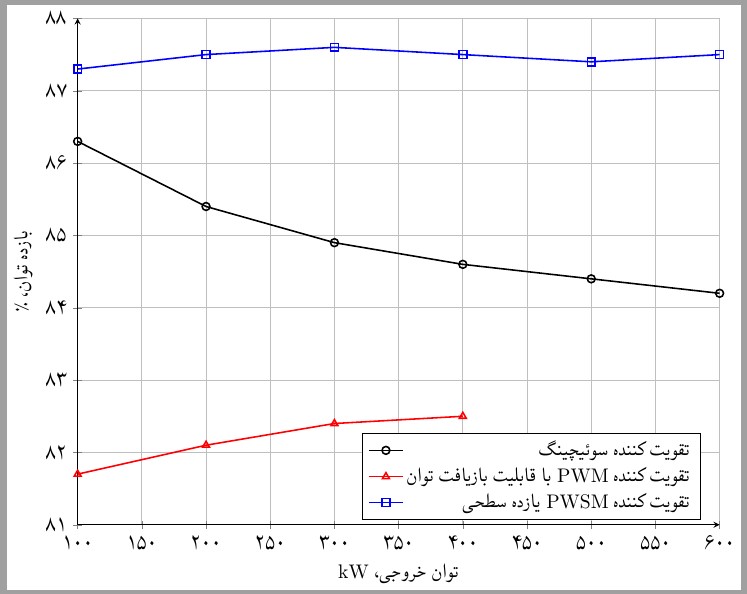
with a simple edit,
% This file was created by matlab2tikz.
%
%The latest updates can be retrieved from
% http://www.mathworks.com/matlabcentral/fileexchange/22022-matlab2tikz-matlab2tikz
%where you can also make suggestions and rate matlab2tikz.
%
\documentclass[tikz]{standalone}
%\usepackage[T1]{fontenc}
\usepackage[utf8]{inputenc}
\usepackage{pgfplots,amsmath}
\usepackage{grffile}
\pgfplotsset{compat=newest}
\usetikzlibrary{plotmarks}
\usetikzlibrary{arrows.meta}
\usepgfplotslibrary{patchplots}
\usepackage[]{xepersian}%displaymathdigits=default
\settextfont[Scale=1]{XB Yas}
\setdigitfont[Scale=1]{XB Yas}
\begin{document}
\begin{tikzpicture}
\begin{axis}[%
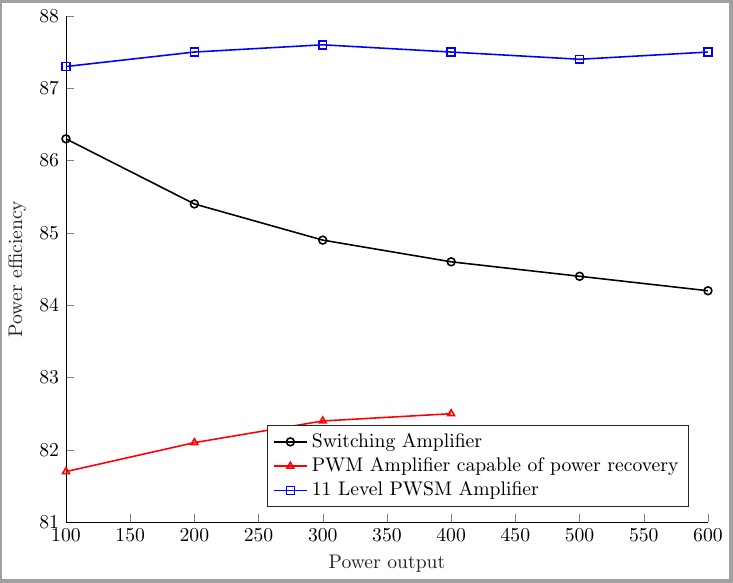
grid=both,
width=4.521in,
height=3.566in,
at={(0.758in,0.481in)},
scale only axis,
xmin=100,
xmax=600,
xlabel={\rl{توان خروجی، $\mathrm{kW}$}},
ymin=81,
ymax=88,
ylabel={\rl{بازده توان، $\%$}},
axis x line=bottom,
axis y line=left,
legend style={at={(0.97,0.01)}, anchor=south east, legend cell align=right, align=right}
]
\addplot [color=black, line width=0.8pt, mark=o, mark options={solid, black}]
table[row sep=crcr]{%
100 86.3\\
200 85.4\\
300 84.9\\
400 84.6\\
500 84.4\\
600 84.2\\
};
\addlegendentry{\rl{تقویت کننده سوئیچینگ}}
\addplot [color=red, line width=0.8pt, mark=triangle, mark options={solid, red}]
table[row sep=crcr]{%
100 81.7\\
200 82.1\\
300 82.4\\
400 82.5\\
};
\addlegendentry{\rl{تقویت کننده \lr{PWM} با قابلیت بازیافت توان}}
\addplot [color=blue, line width=0.8pt, mark=square, mark options={solid, blue}]
table[row sep=crcr]{%
100 87.3\\
200 87.5\\
300 87.6\\
400 87.5\\
500 87.4\\
600 87.5\\
};
\addlegendentry{\rl{تقویت کننده \lr{PWSM} یازده سطحی}}
\end{axis}
\end{tikzpicture}%
\end{document}
thus,