سلام.
امیدوارم کد زیر براتون مفید باشه:
\documentclass[10pt]{report}
\usepackage[utf8]{inputenc}
\usepackage{amsmath}
\usepackage{color}
\usepackage{tikz}
\usepackage{pgf}
\usetikzlibrary{calc}
\usetikzlibrary{positioning}
\begin{document}
\begin{center}
\begin{tikzpicture}[x={(0:4)},y={(90:4)}]
% Here is your definitions...
\newcommand{\txtsize}{\tiny}% one of the following may be used here:
%\tiny  \scriptsize \footnotesize \small \normalsize \large \Large \LARGE \huge \Huge
\newcommand{\func}[1]{1-(#1^2)}
%\def\n{4} % Number of splits.
\newcommand{\n}{4}
\newcommand{\numOfGrids}{4}
\pgfmathsetmacro{\gridStep}{1/\numOfGrids}
% Draw your background here...
	\path[use as bounding box] (-0.2,-0.2) rectangle (1.2,1.2);
	\path[fill=gray!20, opacity=0.3] (0,0) rectangle (1,1);
	\draw[step=\gridStep , loosely dotted] (0,0) grid (1,1);
% Draw your lines, plots, texts and so on, here...
% Here is axes...
	\draw[->] (-0.1,0) -- (1.1,0) node[right] {$x$};
	\draw[->] (0,-0.1) -- (0,1.1) node[above] {$y$};
% Here is the numbers of X and Y ...
	\foreach \i in {1,2,3,4}{
		\pgfmathsetmacro{\num}{\i*\gridStep}
		\draw (0.01,\num)--(-0.01,\num)node[left] {\txtsize$\pgfmathprintnumber[fixed, precision=2]{\num}$};
	}
% Here is the main plot $y=1-x^2$ (for this example)...
	\draw[fill=blue!10,opacity=0.1, domain=0:1,smooth, variable=\x,blue](0,0)--(0,1) plot ({\x},{1-(\x*\x)})--(0,0);
	\draw[domain=0:1,smooth, variable=\x,blue] plot ({\x},{\func{\x}});
	\node[above, blue] at (0.5,1.2) {\small $y=1-x^2$};
% Draw  your rectangles...
\pgfmathsetmacro{\nth}{1/\n}
\def\xSecond{0}
\foreach \i in {1,2,...,\n}{
	\def\xFirst{\i*\nth-\nth}
	\pgfmathsetmacro{\xSecond}{\i*\nth}
	\pgfmathsetmacro{\ySecond}{\func{\xSecond}}
	\draw[fill=red!20,opacity=0.6](\xFirst,0) rectangle(\xSecond,\ySecond);
	\draw[line width=0.5pt,draw=red](\xFirst,0) rectangle(\xSecond,\ySecond);
	\filldraw[black] (\xSecond,\ySecond)node[black, above right]{\txtsize$(\pgfmathprintnumber[fixed, precision=2]{\xSecond},\pgfmathprintnumber[fixed, precision=2]{\ySecond})$} circle(1pt);
	\draw (\xSecond,0.01)--(\xSecond,-0.01)node
%	[left , rotate=90] % USE this command instead of the above one if \n is large enough
		[below]
	{\txtsize$\pgfmathprintnumber[fixed, precision=2]{\xSecond}$};
}
\end{tikzpicture}
%%%%%%%%%%%%%%%%%%%%%%%%%%%%%%%
%%%%%%%%%%%%%%%%%%%%%%%%%%%%%%%
\begin{tikzpicture}[x={(0:4)},y={(90:4)}]
% Here is your definitions...
\newcommand{\txtsize}{\tiny}% one of the following may be used here:
%\tiny  \scriptsize \footnotesize \small \normalsize \large \Large \LARGE \huge \Huge
\newcommand{\func}[1]{1-(#1^2)}
%\def\n{4} % Number of splits.
\newcommand{\n}{6}
\newcommand{\numOfGrids}{4}
\pgfmathsetmacro{\gridStep}{1/\numOfGrids}
% Draw your background here...
\path[use as bounding box] (-0.2,-0.2) rectangle (1.2,1.2);
\path[fill=gray!20, opacity=0.3] (0,0) rectangle (1,1);
\draw[step=\gridStep , loosely dotted] (0,0) grid (1,1);
% Draw your lines, plots, texts and so on, here...
% Here is axes...
\draw[->] (-0.1,0) -- (1.1,0) node[right] {$x$};
\draw[->] (0,-0.1) -- (0,1.1) node[above] {$y$};
% Here is the numbers of X and Y ...
\foreach \i in {1,2,3,4}{
	\pgfmathsetmacro{\num}{\i*\gridStep}
	\draw (0.01,\num)--(-0.01,\num)node[left] {\txtsize$\pgfmathprintnumber[fixed, precision=2]{\num}$};

}
% Here is the main plot $y=1-x^2$ (for this example)...
\draw[fill=blue!30,opacity=0.2, domain=0:1,smooth, variable=\x,blue](0,0)--(0,1) plot ({\x},{1-(\x*\x)})--(0,0);
\draw[domain=0:1,smooth, variable=\x,blue] plot ({\x},{\func{\x}});
\node[above, blue] at (0.5,1.2) {\small $y=1-x^2$};
% Draw  your rectangles...
\pgfmathsetmacro{\nth}{1/\n}
\def\xSecond{0}
\foreach \i in {1,2,...,\n}{
	\def\xFirst{\i*\nth-\nth}
	\pgfmathsetmacro{\xSecond}{\i*\nth}
	\pgfmathsetmacro{\xMid}{(\xFirst+\xSecond)/2}
	\pgfmathsetmacro{\ySecond}{\func{\xMid}}
	\draw[fill=red!20,opacity=0.6](\xFirst,0) rectangle(\xSecond,\ySecond);
	\draw[line width=0.5pt,draw=red](\xFirst,0) rectangle(\xSecond,\ySecond);
	\draw[dashed, color=red, line width=0.5 pt](\xMid,0)--(\xMid,\ySecond)node[black, above right=-0.02 ]{\txtsize$(\pgfmathprintnumber[fixed, precision=2]{\xMid},\pgfmathprintnumber[fixed, precision=2]{\ySecond})$};
	\filldraw[black] (\xMid,\ySecond) circle(1pt);
	\draw (\xMid,0)--(\xMid,-0.08)node
	[left , rotate=90]
%	[below]
	{\txtsize$\pgfmathprintnumber[fixed, precision=3]{\xMid}$};
	\draw (\xSecond,0.01)--(\xSecond,-0.01)node
		[left , rotate=90]
	%	[below] % USE this command instead of the above one if \n is small
	 {\txtsize$\pgfmathprintnumber[fixed, precision=2]{\xSecond}$};
}
\end{tikzpicture}
\end{center}
\end{document}
خروجی:
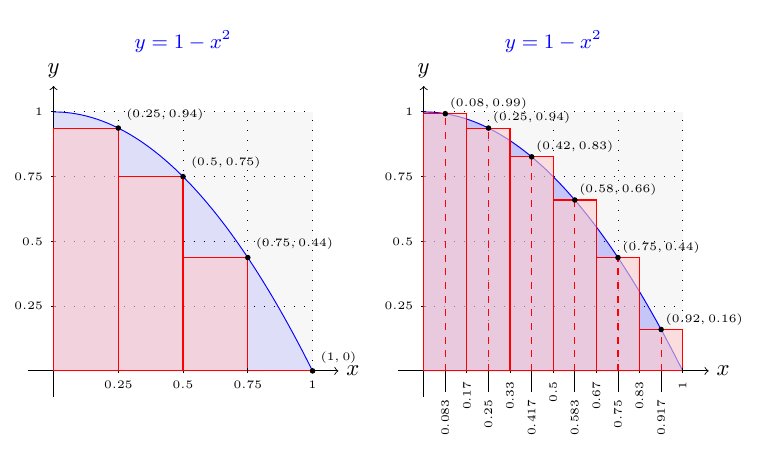
چند پارامتر در این کد وجود دارند (مانند n یا numOfGrid یا ...) که با تغییر هریک به شکلی متناسب با آن پارامتر خواهید رسید.
پیروز و پاینده باشید.

