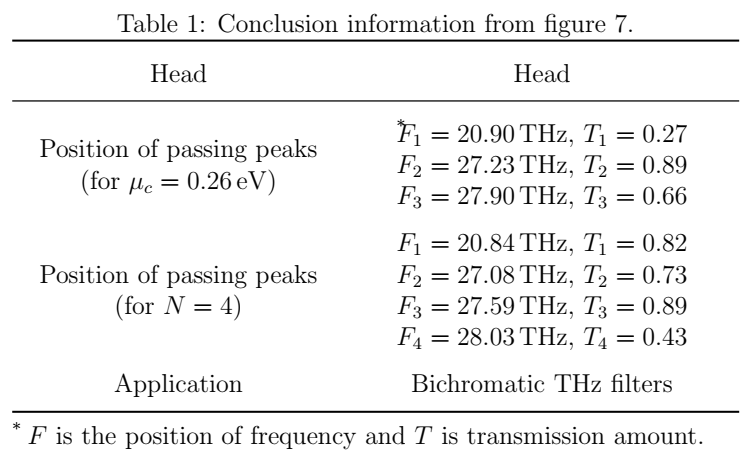
برای این منظور میتوانید از بسته threeparttable استفاده کنید. با دستور \tnote یک ستاره در محل موردنظر قرار میدهیم و سپس در انتهای جدول در محیط tablenotes پاورقی مورد نظر را ایجاد میکنیم.
% !TEX TS-program = pdfLaTeX
\documentclass[12pt]{article}
\usepackage{amsmath}
\usepackage[flushleft]{threeparttable}
\usepackage{booktabs}
\usepackage{siunitx}
\usepackage{array}
\newcolumntype{C}[1]{>{\centering\arraybackslash}m{#1}}

\begin{document}
\begin{table}
\centering
\caption{Conclusion information from figure 7.}
\begin{threeparttable}
	\renewcommand\arraystretch{1.5}
%	\tabcolsep=20pt
\begin{tabular}{C{5cm}  C{6cm}}
\toprule
Head & Head \\
\midrule
Position of passing peaks (for $\mu_c=\SI{0.26}{eV}$) &
$\tnote{*}F_1= \SI{20.90}{THz}$, $T_1=0.27$
$F_2=\SI{27.23}{THz}$, $T_2=0.89$
$F_3=\SI{27.90}{THz}$, $T_3=0.66$ \\
Position of passing peaks (for $N=4$) &
$F_1=\SI{20.84}{THz}$, $T_1=0.82$
$F_2=\SI{27.08}{THz}$, $T_2=0.73$
$F_3=\SI{27.59}{THz}$, $T_3=0.89$
$F_4=\SI{28.03}{THz}$, $T_4=0.43$ \\
Application & Bichromatic \si{THz} filters \\
\bottomrule
\end{tabular}
\begin{tablenotes}
      \item[*] $F$ is the position of frequency and $T$ is transmission amount.
\end{tablenotes}
\end{threeparttable}
\end{table}
\end{document}
نتیجه:
