سلام
با لوالاتک سریعتر خروجی به دست می آید:
% !TeX program=lualatex
\documentclass[border=1pt]{standalone}
\usepackage{pgfplots}
\pgfplotsset{compat=1.18}
\begin{document}
\begin{tikzpicture}
\begin{axis}[
width=12cm,
height=9cm,
axis lines = center,
xlabel = {$x$},
zlabel = {$y$},
xmin=0, xmax=5,
ymin=-1, ymax=1,
zmin=-1.2, zmax=1.2,
view = {20}{20},
z buffer=sort,
ytick=\empty,
y axis line style={draw=none},
ylabel style={draw=none},
colormap/cool,
]
% ناحیه پر شده (صفحه عمودی در y=0)
\addplot3[
surf,
shader =interp,
samples = 40,
samples y = 2,
domain = 1:4,
domain y = 0:1,
opacity = 0.4,
draw = blue!50!black, thin
]
({x}, {0}, {y*(1/x)});
% منحنی مرزی
\addplot3[
very thick,
red,
domain = 1:4,
samples = 60
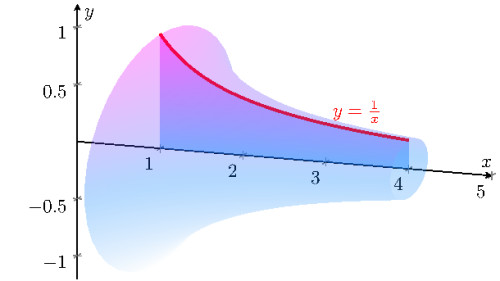
]
({x}, {0}, {1/x})
node[pos=0.8, above] {$y = \frac{1}{x}$};
% سطح حاصل از دوران
\addplot3[
surf,
shader = interp,
samples = 30,
samples y = 36,
domain = 1:4,
domain y = 0:360,
z buffer = sort,
opacity = 0.3
]
({x}, {(1/x)*cos(y)}, {(1/x)*sin(y)});
\end{axis}
\end{tikzpicture}
\end{document}