سلام
در هنگام پرسیدن سؤال بهتر است نتیجه تلاشهایتان برای حل سؤال رو ضمیمه بکنید یا حداقل تصویری از آنچه مطلوبتان است را بارگذاری نمایید.
برای ترسیم نمودارهای ریاضی و بسیاری از شکلها میتوان از بسته توانمند TikZ استفاده کرد. برای آشنایی با این بسته، راهنمای مفصل و کامل آن را میتوانید مطالعه کنید. البته برای آشنایی اولیه، مطالعه راهنمای مختصر TikZ کارگشا است.
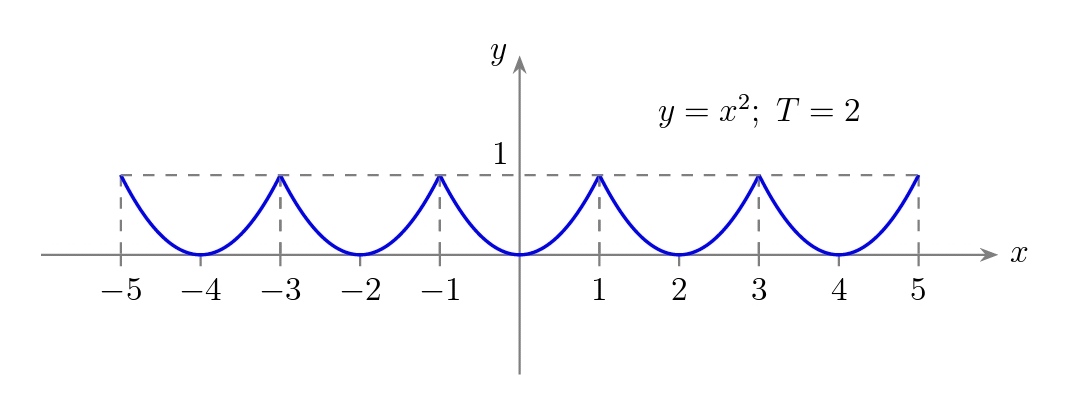
من این شکل را به صورت زیر با استفاده از TikZ ترسیم کردهام.
\documentclass[12pt, border=5mm]{standalone}
\usepackage{tikz}
\usetikzlibrary{arrows.meta}
\begin{document}
\begin{tikzpicture}[axis/.style={gray, thick, -Stealth}]
\draw [axis] (-6,0) -- (6,0) node [right, black] {$x$};
\draw [axis] (0,-1.5) -- (0,2.5) node [left, black] {$y$};
\foreach \a in {-5,-4,-3,-2,-1,1,2,3,4,5}
\draw [gray, thick] (\a,0) -- (\a,-4pt) node [below, black] {$\a$};
\node [above left] at (0,1) {1};
\foreach \T in {-4,-2,0,2,4}
{
\draw [gray, thick, dashed, dash pattern=on 4pt off 4pt, xshift=\T cm] (-1,1) -- (-1,0) (1,1) -- (1,0);
\draw [blue, very thick, variable=\x, domain=-1:1, samples=50, xshift=\T cm] plot ({\x},{pow(\x,2)});
}
\draw [gray, thick, dashed, dash pattern=on 4pt off 4pt] (-5,1) -- (5,1);
\node at (3,1.8) {$y=x^2;\; T=2$};
\end{tikzpicture}
\end{document}

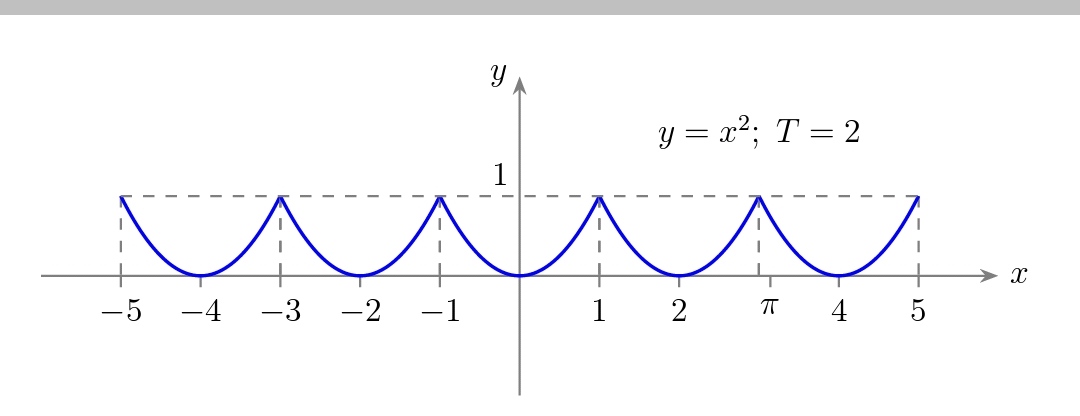
ویرایش اول با توجه به خواسته مطرح شده در بخش نظرات:
\documentclass[12pt, border=5mm]{standalone}
\usepackage{tikz}
\usetikzlibrary{arrows.meta}
\begin{document}
\begin{tikzpicture}[axis/.style={gray, thick, -Stealth}]
\draw [axis] (-6,0) -- (6,0) node [right, black] {$x$};
\draw [axis] (0,-1.5) -- (0,2.5) node [left, black] {$y$};
\foreach \a [count=\i] in {-5,-4,-3,-2,-1,1,2,pi,4,5}
{
\draw [gray, thick] (\a,0) -- (\a,-4pt)
\ifnum\i=8
node [below, black] {$\pi$};
\else
node [below, black] {$\a$};
\fi
}
\node [above left] at (0,1) {1};
\foreach \T in {-4,-2,0,2,4}
{
\draw [gray, thick, dashed, dash pattern=on 4pt off 4pt, xshift=\T cm] (-1,1) -- (-1,0) (1,1) -- (1,0);
\draw [blue, very thick, variable=\x, domain=-1:1, samples=50, xshift=\T cm] plot ({\x},{pow(\x,2)});
}
\draw [gray, thick, dashed, dash pattern=on 4pt off 4pt] (-5,1) -- (5,1);
\node at (3,1.8) {$y=x^2;\; T=2$};
\end{tikzpicture}
\end{document}

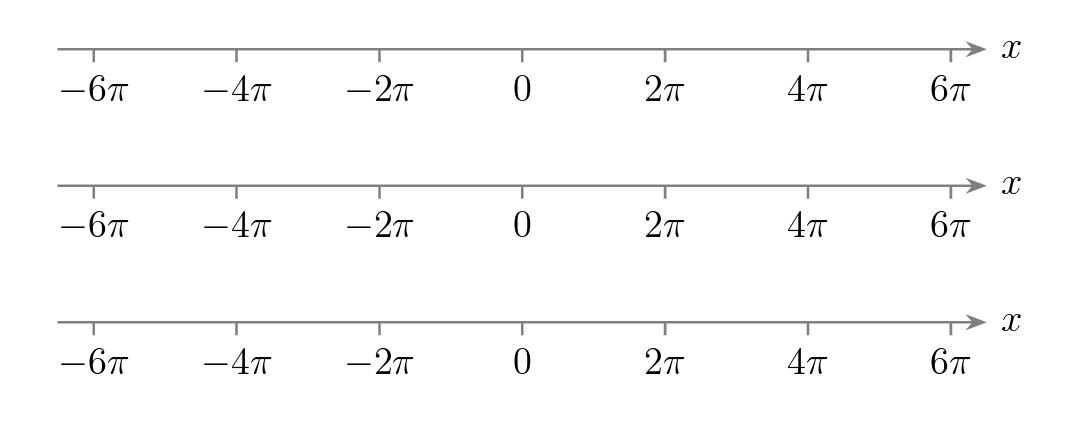
ویرایش دوم برای ترسیم محور اعداد:
به سه طریق میتوان این کار را انجام داد و خروجی هر سه روش یکسان است.
\documentclass[12pt, border=5mm]{standalone}
\usepackage{tikz}
\usetikzlibrary{arrows.meta}
\begin{document}
\begin{tikzpicture}[xscale=0.25]
\draw [gray, thick, -Stealth] (-6.5*pi,0) -- (6.5*pi,0) node [right, black] {$x$};
\foreach \i [evaluate=\i as \x using \i*3.14, count=\h] in {-6,-4,-2,0,2,4,6}
{
\ifnum\h=4
\draw [gray, thick, xshift=\x cm] (0,0) -- (0,-4pt) node [below, black] {$\i$};
\else
\draw [gray, thick, xshift=\x cm] (0,0) -- (0,-4pt) node [below, black] {$\i\pi$};
\fi
}

\begin{scope}[yshift=-1.5cm]
\draw [gray, thick, -Stealth] (-6.5*pi,0) -- (6.5*pi,0) node [right, black] {$x$};
\foreach \x/\label in {-18.84/{-6\pi}, -12.56/{-4\pi}, -6.28/{-2\pi}, 0/0, 6.28/{2\pi}, 12.56/{4\pi}, 18.84/{6\pi}}
\draw [gray, thick, xshift=\x cm] (0,0) -- (0,-4pt) node [below, black] {$\label$};
\end{scope}

\begin{scope}[yshift=-3cm]
\draw [gray, thick, -Stealth] (-6.5*pi,0) -- (6.5*pi,0) node [right, black] {$x$};
\foreach \m [count=\h] in {-6,-4,...,6}
{
\pgfmathsetmacro\result{\m*3.14}
\ifnum\h=4
\draw [gray, thick, xshift=\result cm] (0,0) -- (0,-4pt) node [below, black] {$0$};
\else
\draw [gray, thick, xshift=\result cm] (0,0) -- (0,-4pt) node [below, black] {$\m\pi$};
\fi
}
\end{scope}
\end{tikzpicture}
\end{document}
