با سلام
از آنجایی که فایل vali.dat را پیوست نکرده اید، اجرای فایل کمینه ی پیوستی تان به خطا منجر می شود. اما با تغییر اندکی و در نظر نگرفتن این خطا، کدهایی به صورتی که در ادامه خواهد آمد تهیه شده است.
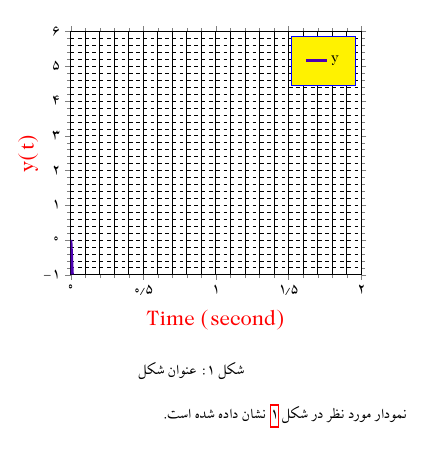
قبل از هر چیز باید عرض کنم که کد اول در صورتی جواب مورد نظر شما خواهد بود که منظور شما از اضافه کردن caption به نمودار، اضافه نمودن عنوان به یک شکل (figure) باشد:
\documentclass[12pt,a4paper]{report}
\usepackage{xcolor}
\usepackage{graphicx}
\usepackage{fixltx2e}
\usepackage{amsmath,amssymb,mathtools}
\usepackage{MnSymbol}
\usepackage{hyperref}
\usepackage{caption}
\usepackage{float}
\usepackage{ulem}
\usepackage{pgfplots}
\usepackage{xepersian}
\DeclareGraphicsExtensions{.pdf,.png,.jpg}
\settextfont{XB Zar}
\setdigitfont{XB Zar}
\definecolor{a}{RGB}{84,109,204}
\defpersianfont\myfont{IranNastaliq}
\newcommand{\myhyperref}[2]{\hyperref[#1]{#2\ref*{#1}}}
\hyphenation{MATLAB}
\begin{document}
\begin{figure}
\begin{center}
\begin{tikzpicture}
\begin{axis}
[
xlabel ={Time (second)},ylabel ={y(t)},xmin =0 , xmax =2,ymin =-1 ,ymax = 6, xtick ={0,0.5,...,2},ytick ={-1,0,...,6}, xtick align = outside , ytick align = outside ,minor tick num =4,width =10cm ,xlabel style = {font =\Large , color = red,at ={ (axis description cs: 0.5 , -0.05) } }
, ylabel style = {font =\Large , color = red }, yminorgrids , ymajorgrids , y grid style = {color =black,thin,dashed},xmajorgrids,xminorgrids,x grid style ={color =black,thick,solid},legend style ={inner xsep = 4mm,inner ysep = 5mm, fill =yellow,draw =blue}
]
\legend{y,dy}
\addplot [line width =1mm , color =blue!70!red , style =solid ]
(0,0)--(1,1);
\end{axis}
\end{tikzpicture}
\end{center}
\caption{عنوان شکل}
\label{fig:001}
\end{figure}
نمودار مورد نظر در شکل \ref{fig:001} نشان داده شده است.
\end{document}
خروجی:

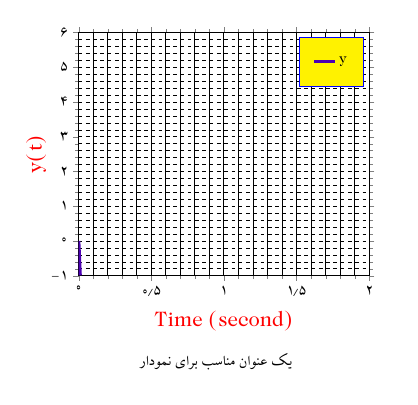
اما در صورتی که منظور شما عنوان دهی به شکل (figure) نیست، پیشنهاد می کنم از یک دستور node برای قرار دادن متنی برای عنوان نمودار مورد نظر خود در محیط tikzpicture و خارج از محیط axis استفاده نمایید:
\documentclass[12pt,a4paper]{report}
\usepackage{xcolor}
\usepackage{graphicx}
\usepackage{fixltx2e}
\usepackage{amsmath,amssymb,mathtools}
\usepackage{MnSymbol}
\usepackage{hyperref}
\usepackage{caption}
\usepackage{float}
\usepackage{ulem}
\usepackage{pgfplots}
\usepackage{xepersian}
\DeclareGraphicsExtensions{.pdf,.png,.jpg}
\settextfont{XB Zar}
\setdigitfont{XB Zar}
\definecolor{a}{RGB}{84,109,204}
\defpersianfont\myfont{IranNastaliq}
\newcommand{\myhyperref}[2]{\hyperref[#1]{#2\ref*{#1}}}
\hyphenation{MATLAB}
\begin{document}
\begin{center}
\begin{tikzpicture}
\begin{axis}
[
xlabel ={Time (second)},ylabel ={y(t)},xmin =0 , xmax =2,ymin =-1 ,ymax = 6,   xtick ={0,0.5,...,2},ytick ={-1,0,...,6}, xtick align = outside , ytick align = outside ,minor tick num =4,width  =10cm ,xlabel style = {font =\Large , color = red,at ={ (axis description cs: 0.5 , -0.05) } }
, ylabel style = {font =\Large , color = red }, yminorgrids , ymajorgrids ,      y grid style = {color =black,thin,dashed},xmajorgrids,xminorgrids,x grid style ={color =black,thick,solid},legend style ={inner xsep = 4mm,inner ysep = 5mm, fill =yellow,draw =blue}
]
\legend{y,dy}

\addplot [line width =1mm , color =blue!70!red , style =solid ]
(0,0)--(1,1);
\end{axis}
\node at (4,-2.5){\rl {یک عنوان مناسب برای نمودار}};
\end{tikzpicture}
\end{center}
\end{document}
خروجی:
