سلام
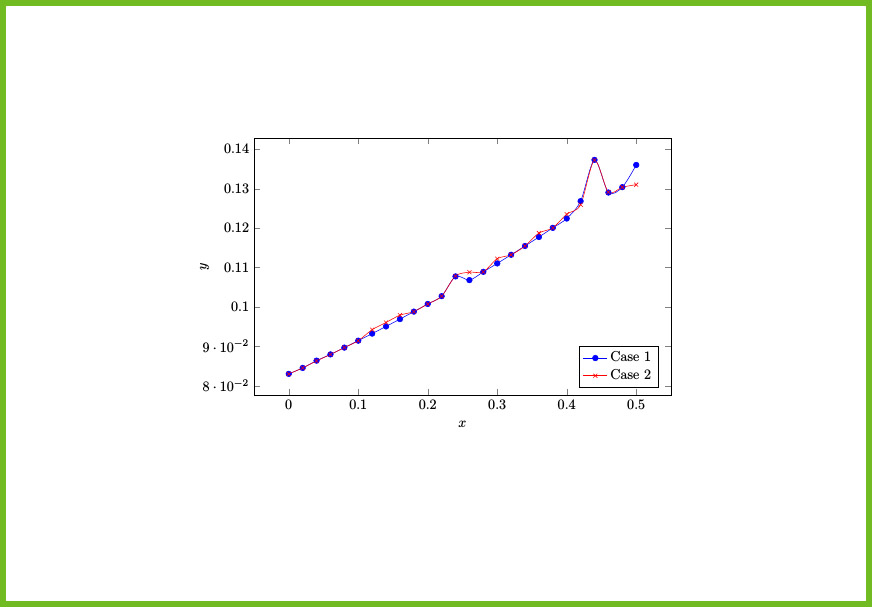
دو آپشن width و height برای تنظیم پهنا و ارتفاع در این محیط است
با کمک این دو دستور داریم:
\documentclass{article}
\usepackage{tikz}
\usepackage{pgfplots}
\begin{document}

\begin{center}
\begin{tikzpicture}
    \begin{axis}[legend pos=south east,
        xlabel=$x$,
        ylabel=$y$, width=12cm,height=8cm]
            \addplot[smooth,mark=*,blue]
     plot coordinates {
         (0.000000,0.083010)
                    (0.020000,0.084519)
                    (0.040000,0.086371)
                    (0.060000,0.087957)
                    (0.080000,0.089676)
                    (0.100000,0.091433)
                    (0.120000,0.093230)
                    (0.140000,0.095046)
                    (0.160000,0.096908)
                    (0.180000,0.098808)
                    (0.200000,0.100747)
                    (0.220000,0.102725)
                    (0.240000,0.107743)
                    (0.260000,0.106801)
                    (0.280000,0.108901)
                    (0.300000,0.111034)
                    (0.320000,0.113230)
                    (0.340000,0.115460)
                    (0.360000,0.117735)
                    (0.380000,0.120056)
                    (0.400000,0.122424)
                    (0.420000,0.126839)
                    (0.440000,0.137304)
                    (0.460000,0.129018)
                    (0.480000,0.130383)
                    (0.500000,0.136010)
    };
    \addlegendentry{Case 1}

    \addplot[smooth,color=red,mark=x]
        plot coordinates {
            (0.000000,0.083000)
                                    (0.020000,0.084519)
                                    (0.040000,0.086281)
                                    (0.060000,0.087937)
                                    (0.080000,0.089676)
                                    (0.100000,0.091430)
                                    (0.120000,0.094220)
                                    (0.140000,0.096046)
                                    (0.160000,0.097908)
                                    (0.180000,0.098808)
                                    (0.200000,0.100747)
                                    (0.220000,0.102725)
                                    (0.240000,0.107843)
                                    (0.260000,0.108802)
                                    (0.280000,0.108901)
                                    (0.300000,0.112234)
                                    (0.320000,0.113230)
                                    (0.340000,0.115460)
                                    (0.360000,0.118735)
                                    (0.380000,0.120056)
                                    (0.400000,0.123524)
                                    (0.420000,0.125939)
                                    (0.440000,0.137204)
                                    (0.460000,0.129128)
                                    (0.480000,0.130372)
                                    (0.500000,0.131011)
        };
    \addlegendentry{Case 2}
       \end{axis}
    \end{tikzpicture}
\end{center}
\end{document}
خروجی شما به صورت زیر است:

موفق باشید.