سلام
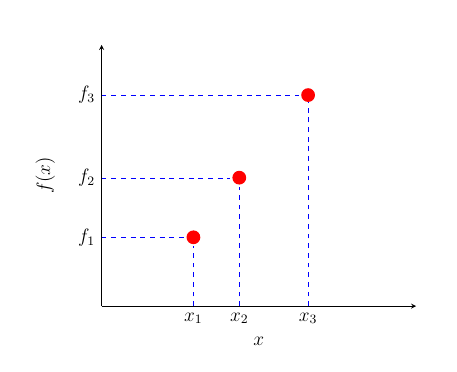
یه روشش اینه که با دستور node، برای هر نقطه، اسم بذارید.
\documentclass[12pt]{article}
\usepackage{tikz,pgfplots}
\usepackage{amsmath}
\begin{document}
\begin{center}
	\begin{tikzpicture}
		\begin{axis} [xlabel = $x$, ylabel = $f(x)$, axis lines = left,ticks=none]
		\end{axis}
		\fill [red] (2,1.5) circle (1.5mm);
		\fill [red] (3,2.8) circle (1.5mm);
		\fill [red] (4.5,4.6) circle (1.5mm);
		\draw [dashed,blue, ultra thin] (2,0) node [below, black] {$ x_1 $} --(2,1.3);
		\draw [dashed,blue, ultra thin] (0,1.5) node [left, black] {$ f_1 $} --(1.8,1.5);
		\draw [dashed,blue, ultra thin] (3,0) node [below, black] {$ x_2 $} --(3,2.6);
		\draw [dashed,blue, ultra thin] (0,2.8) node [left, black] {$ f_2 $} --(2.8,2.8);
		\draw [dashed,blue, ultra thin] (4.5,0) node [below, black] {$ x_3 $} --(4.5,4.45);
		\draw [dashed,blue, ultra thin] (0,4.6) node [left, black] {$ f_3 $} --(4.3,4.6);
	\end{tikzpicture}
\end{center}
\end{document}
یه روش دیگه هم اینه که با حلقه این کارو بکنین.
\documentclass[12pt]{article}
\usepackage{tikz,pgfplots}
\usepackage{amsmath}
\begin{document}
\begin{center}
	\begin{tikzpicture}
		\begin{axis} [xlabel = $x$, ylabel = $f(x)$, axis lines = left,ticks=none]
		\end{axis}
		\fill [red] (2,1.5) {} circle (1.5mm);
		\fill [red] (3,2.8) circle (1.5mm);
		\fill [red] (4.5,4.6) circle (1.5mm);
		\draw [dashed,blue, ultra thin] (2,0)--(2,1.3);
		\draw [dashed,blue, ultra thin] (0,1.5)--(1.8,1.5);
		\draw [dashed,blue, ultra thin] (3,0)--(3,2.6);
		\draw [dashed,blue, ultra thin] (0,2.8)--(2.8,2.8);
		\draw [dashed,blue, ultra thin] (4.5,0)--(4.5,4.45);
		\draw [dashed,blue, ultra thin] (0,4.6)--(4.3,4.6);
		\foreach \x/\xtext in {2/$ x_1 $, 3/$ x_2 $, 4.5/$ x_3 $}
		{\draw (\x, 0) node [below] {\xtext};}
		\foreach \y/\ytext in {1.5/$ f_1 $, 2.8/$ f_2 $, 4.6/$ f_3 $}
		{\draw (0, \y) node [left] {\ytext};}
	\end{tikzpicture}
\end{center}
\end{document}
خروجی:
