با سلام
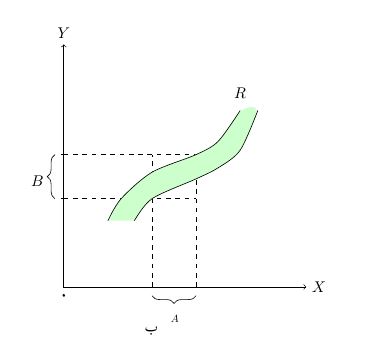
برای رنگ آمیزی بین دو نمودار می توانید به صورت زیر از دستور \filldraw استفاده کنید:
\documentclass{article}
\usepackage{pgfkeys,diagbox,tikz}
\usepackage{mathabx}
\usepackage{xepersian}
\settextfont{XB Yas}
\setdigitfont{XB Yas}
\begin{document}
\usetikzlibrary{positioning,decorations.pathreplacing,matrix}
\usetikzlibrary{mindmap,trees,shadows}
\usetikzlibrary{patterns}
 \tikzstyle{state}=[thick,scale=1]
\begin{tikzpicture}[decoration={brace,amplitude=5pt}]
\draw[->] (0,0) -- (5.5,0) node[right] {$X$};
\draw[->] (0,0) -- (0,5.5) node[above] {$Y$};
         \draw (0,1pt) -- (0,-1pt) node[below] {$0$};
        \draw (2,1pt) -- (2,-1pt) node[below] {};
        \draw (0pt,2) -- (-2pt,2) node[left] {};
        \draw (0pt,3) -- (-2pt,3) node[left] {};
  \draw[style = dashed] (2,0) -- (2,3);
  \draw[style = dashed] (3,0) -- (3,3);
   \draw[style = dashed] (0,2) -- (3,2);
    \draw[style = dashed] (0,3) -- (3,3);
\filldraw[style=smooth,fill=green!20!white, draw=green!20!white]
plot coordinates{(1,1.5)(1.3,2)(2,2.6)(3,3)(3.5,3.3)(4,3.97)(4.37,4)(4,3.1)(3.5,2.7)(3,2.45)(2,2)(1.6,1.5)};
      \draw[style=smooth]plot coordinates{(1,1.5)(1.3,2)(2,2.6)(3,3)(3.5,3.3)(4,4)};
   \draw[style=smooth] plot coordinates{(1.6,1.5)(2,2)(3,2.45)(3.5,2.7)(4,3.1)(4.4,4)};

   \node [state](A)[yshift=4.4cm,xshift=4cm] {$R$};
    \node [state](B)[yshift=-1cm,xshift=2cm] {ب};
    \node [state](C)[draw=none,scale=0.68,yshift=-0.6cm,xshift=3.7cm,anchor=north,inner sep=5pt, outer sep=5pt] {$A$};
    \draw [decorate] (-0.2,2) -- (-0.2,3);
    \draw [decorate] (3.0,-0.2)--(2,-0.2);
     \node [state](D)[midway,=east,inner sep=5pt, outer sep=5pt,xshift=-0.6cm,yshift=2.4cm] {$B $};
\end{tikzpicture}
\end{document}
نتیجه به صورت زیر خواهد بود:
