سلام
توصیهی اول من به شما مطالعهی راهنمای بستهی تیکز و مشتقات آن است.
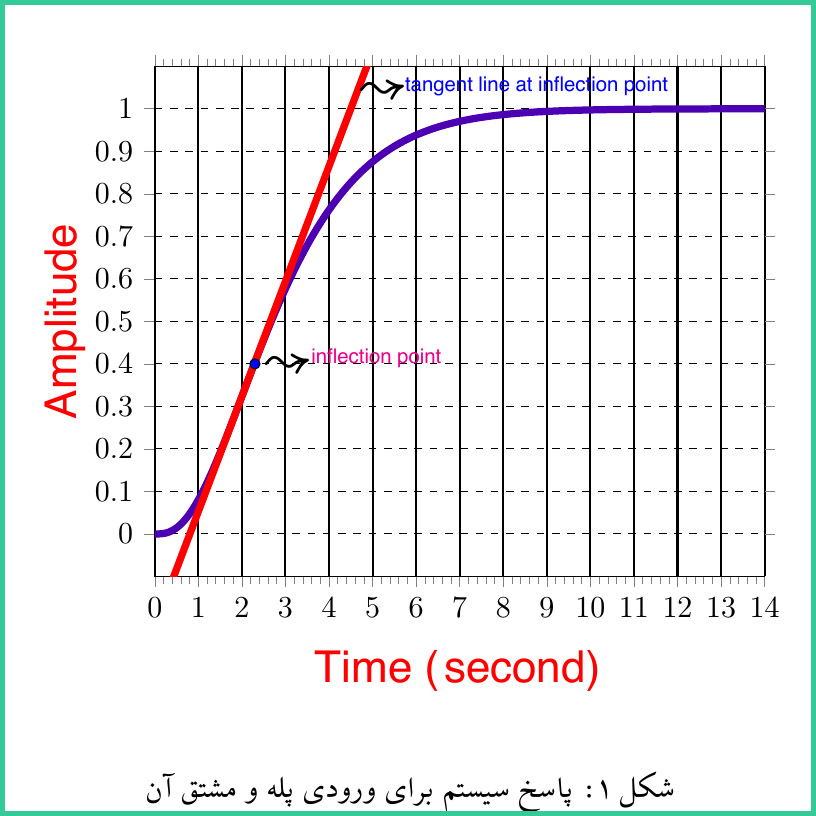
اما با توجه به مختصات نقطهها در شکل اینکار با کمی وقت گذاشتن به سادگی قابل انجام است.
کدهای شما به صورت زیر است:
\documentclass[12pt,a4paper]{report}
\usepackage{xcolor,colortbl}
\usepackage{graphicx}
\usepackage{fixltx2e}
\usepackage{amsmath,amssymb,mathtools}
\usepackage{MnSymbol}
%\usepackage{stix}
\usepackage{hyperref}
\usepackage{caption}
\usepackage{subcaption}
\usepackage{float}
\usepackage{ulem}
\usepackage{multirow}
\usepackage{pgfplots}
\usepackage[framed,numbered,autolinebreaks,useliterate]{mcode}
\usepackage[numbers,sort&compress]{natbib}
\usepackage{xepersian}
\DeclareGraphicsExtensions{.pdf,.png,.jpg}
\settextfont{XB Zar}
%\setdigitfont{XB Zar}
\definecolor{a}{RGB}{84,109,204}
\defpersianfont\myfont{IranNastaliq}
\newcommand{\myhyperref}[2]{\hyperref[#1]{#2\ref*{#1}}}
\hyphenation{MATLAB}
\linespread{1.5}
\lstdefinestyle{MADAD}{%
captiondirection=RTL,language=Matlab
}
\def\lstlistingname{برنامه}

\pagenumbering{alph}
\begin{document}

\begin{figure}[H]
\begin{center}
\begin{tikzpicture}
\begin{axis}
[
xlabel ={Time (second)},ylabel ={Amplitude},xmin =0 , xmax =14,ymin =-0.1 ,ymax = 1.1,   xtick ={0,1,...,15},ytick ={0,0.1,...,1.1}, xtick align = outside , ytick align = outside ,minor tick num =4,width  =10cm ,xlabel style = {font =\Large , color = red,at ={ (axis description cs: 0.5 , -0.05) } }
, ylabel style = {font =\Large , color = red }, yminorgrids , ymajorgrids ,      y grid style = {color =black,thin,dashed},xmajorgrids,x grid style ={color =black,thick,solid},legend style ={inner xsep = 4mm,inner ysep = 5mm, fill =yellow,draw =blue}
]


\addplot [line width =1mm , color =blue!70!red , style =solid,smooth ]
table[y index =0, x index =1]
{ali.dat};

\addplot [line width =1mm , color =red , style =solid,smooth ]
table[y index =2, x index =1]
{reza.dat};
\addplot [blue, mark=*, mark options={draw=black}, only marks]
coordinates {
	(2.3,0.4)
};
\node at (axis cs:2.2,.455) [anchor=north west] {{\Huge $\leadsto$}};
\node at (axis cs:3.35,.46) [magenta,anchor=north west] {{\scriptsize inflection point}};
\node at (axis cs:4.39,1.1) [anchor=north west] {{\Huge $\leadsto$}};
\node at (axis cs:5.5,1.1) [blue,anchor=north west] {{{\scriptsize tangent line at inflection point}}};
\end{axis}
\end{tikzpicture}
\end{center}
\caption{پاسخ سیستم برای ورودی پله و مشتق آن}
\label{pic.7}
\end{figure}
\end{document}
یک نکتهی دیگه اینکه فایل کمینه فایلی با حداقل بسته میباشد. بستههای زیادی در فایل شما برای این درس نیاز نمیباشند.
و اینم خروجی شما با نسخههای اولیهی تکلایو 2018:

موفق باشید.