نکات زیر را توجه فرمایید:
۱ـ فایل پر از کاراکترهای <200e> بود که دلیلش را در نیافتم! نمیدانم شاید از ویرایشگر خاصی استفاده مینمایید که این کاراکترها را قرار میدهد!
۲- تمامی بستهها بیاد پیش از شروع سند لود شود و نه بعد از آن.
۳- کپشن باید در محیط جدول table قرار گیرد و نه بیرون از آن.
و اما پاسخ شما:
علت این است که عرض جدول شما از عرض متن (\textwidth) بیشتر است.
کد صحیح از زیر درجچ شده است:
\documentclass{article}
\usepackage{graphicx}

\usepackage{caption}
\usepackage{multirow}
\usepackage{lipsum}
\usepackage{caption}
\captionsetup{font=footnotesize}

\begin{document}
\lipsum[1]

\begin{table}[]
\centering
\scalebox{0.68}{
\begin{tabular}{|c|c|c|c|c|c|c|c|c|c|c|c|c|c|}
\hline
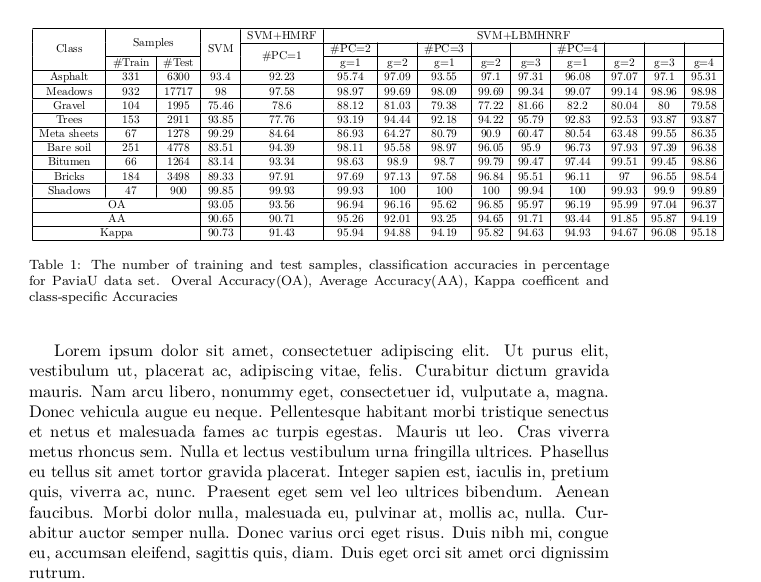
\multirow{3}{*}{Class} & \multicolumn{2}{c|}{\multirow{2}{*}{Samples}} & \multirow{3}{*}{SVM} & SVM+HMRF                & \multicolumn{9}{c|}{SVM+LBMHNRF}                                         \\ \cline{5-14}
                       & \multicolumn{2}{c|}{}                         &                      & \multirow{2}{*}{\#PC=1} & \#PC=2 &       & \#PC=3 &       &       & \#PC=4 &       &       &       \\ \cline{2-3} \cline{6-14}
                       & \#Train                & \#Test               &                      &                         & g=1    & g=2   & g=1    & g=2   & g=3   & g=1    & g=2   & g=3   & g=4   \\ \hline
Asphalt                & 331                    & 6300                 & 93.4                 & 92.23                   & 95.74  & 97.09 & 93.55  & 97.1  & 97.31 & 96.08  & 97.07 & 97.1  & 95.31 \\ \hline
Meadows                & 932                    & 17717                & 98                   & 97.58                   & 98.97  & 99.69 & 98.09  & 99.69 & 99.34 & 99.07  & 99.14 & 98.96 & 98.98 \\ \hline
Gravel                 & 104                    & 1995                 & 75.46                & 78.6                    & 88.12  & 81.03 & 79.38  & 77.22 & 81.66 & 82.2   & 80.04 & 80    & 79.58 \\ \hline
Trees                  & 153                    & 2911                 & 93.85                & 77.76                   & 93.19  & 94.44 & 92.18  & 94.22 & 95.79 & 92.83  & 92.53 & 93.87 & 93.87 \\ \hline
Meta sheets            & 67                     & 1278                 & 99.29                & 84.64                   & 86.93  & 64.27 & 80.79  & 90.9  & 60.47 & 80.54  & 63.48 & 99.55 & 86.35 \\ \hline
Bare soil              & 251                    & 4778                 & 83.51                & 94.39                   & 98.11  & 95.58 & 98.97  & 96.05 & 95.9  & 96.73  & 97.93 & 97.39 & 96.38 \\ \hline
Bitumen                & 66                     & 1264                 & 83.14                & 93.34                   & 98.63  & 98.9  & 98.7   & 99.79 & 99.47 & 97.44  & 99.51 & 99.45 & 98.86 \\ \hline
Bricks                 & 184                    & 3498                 & 89.33                & 97.91                   & 97.69  & 97.13 & 97.58  & 96.84 & 95.51 & 96.11  & 97    & 96.55 & 98.54 \\ \hline
Shadows                & 47                     & 900                  & 99.85                & 99.93                   & 99.93  & 100   & 100    & 100   & 99.94 & 100    & 99.93 & 99.9  & 99.89 \\ \hline
\multicolumn{3}{|c|}{OA}                                               & 93.05                & 93.56                   & 96.94  & 96.16 & 95.62  & 96.85 & 95.97 & 96.19  & 95.99 & 97.04 & 96.37 \\ \hline
\multicolumn{3}{|c|}{AA}                                               & 90.65                & 90.71                   & 95.26  & 92.01 & 93.25  & 94.65 & 91.71 & 93.44  & 91.85 & 95.87 & 94.19 \\ \hline
\multicolumn{3}{|c|}{Kappa}                                            & 90.73                & 91.43                   & 95.94  & 94.88 & 94.19  & 95.82 & 94.63 & 94.93  & 94.67 & 96.08 & 95.18 \\ \hline
\end{tabular}
}
\caption{The number of training and test samples, classification accuracies in percentage for PaviaU data set. Overal Accuracy(OA), Average Accuracy(AA), Kappa coefficent and class-specific Accuracies}
\label{PaviaUPC}
\end{table}
\lipsum[2]
\end{document}
نتیجه را در تصویر نگرید.

باید اندازه داخل scalebox را تغییر دهید.