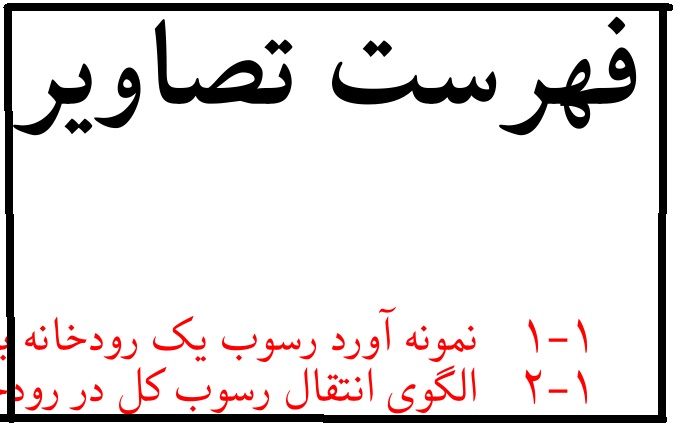
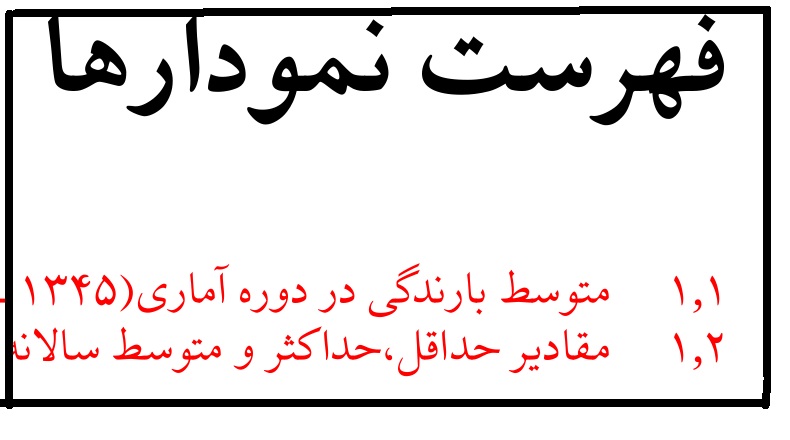
سلام. من در متن پایان نامم از دستورcurve طبق پاسخ بالا برای نمودارهام استفاده کردم. در لاتک من نموداری نکشیدم به جای اون عکس از نمودارهام گرفتم و اون ها رو با عنوان زیرنویس نمودار به لاتک معرفی کردم. مشکلی که دارم اینه که بین اعداد زیرنویس نمودارهام، هم در متنم هم در فهرست مطالب، "کاما" قرار داره که میبایست "خط تیره" بشه. برای سکشن و جداول و تصاویرم چنین مشکلی ندارم. فقط مشکلم با نمودارهاست.
ممنون میشم راهنمایی بفرمایید.


   \documentclass[a4paper,10pt]{report}
\usepackage[fleqn]{amsmath}
\DeclareMathSizes{10}{14}{8}{9}
\usepackage{graphicx}
\usepackage{pgfplots}
\usepackage{tikz}
\usepackage{setspace}
\usepackage{fancyhdr}
\usepackage[labelfont=bf,textfont=bf]{caption}
\usepackage{ptext}
\usepackage{tocloft}
\usepackage[font={footnotesize}]{caption}
\DeclareCaptionType{curve}[نمودار][فهرست نمودارها]
\usepackage{float}
\usepackage{indentfirst}
\usepackage[nottoc]{tocbibind}
\usepackage[colorlinks,citecolor=blue]{hyperref}
\usepackage{zref-perpage}
\usepackage{titlesec}
\usepackage[figuresleft]{rotating}

\usepackage[top=2.5cm,right=3.5cm,bottom=2.5cm,left=2.5cm]{geometry}
\usepackage[extrafootnotefeatures]{xepersian}

\graphicspath{{images/}}
\makeatletter
\SepMark{-}

\def\@seccntformat#1{\csname the#1\endcsname\@SepMark\quad}

\renewcommand{\cftsecaftersnum}{\@SepMark}%
\renewcommand{\cftsubsecaftersnum}{\@SepMark}%
\renewcommand{\cftsubsubsecaftersnum}{\@SepMark}%

\renewcommand*\l@section{\@dottedtocline{1}{2.5em}{2.3em}}
\renewcommand*\l@subsection{\@dottedtocline{2}{3.5em}{3.5em}}
\renewcommand*\l@subsubsection{\@dottedtocline{3}{4.8em}{4.8em}}

\setlength{\cftfignumwidth}{12mm}
\setlength{\cfttabnumwidth}{12mm}

\makeatother
\DeclareCaptionLabelSeparator{colon}{\ }
\captionsetup{belowskip=20pt,aboveskip=10pt}

\settextfont[Scale=1.4]{XB Niloofar}
\setdigitfont[Scale=1]{XB Niloofar}
\setlatintextfont[Scale=1.4]{Times New Roman}
\begin{document}
\tableofcontents
\listoffigures
\listofcurves

\chapter{فصل1}
متن متن متن متن متن متن متن متن متن متن متن متن متن متن متن متن متن متن متن متن متن

\begin{curve}[H]
\begin{center}
\includegraphics[scale=0.6]{1-1}
\caption{متن زیر نویس}
\label{fig:1-1}
\end{center}
\end{curve}
متن متن متن متن متن متن متن متن متن متن متن متن متن متن متن متن متن متن متن متن
\begin{figure}[H]
\centering
\includegraphics[scale=0.55]{1-1}
\caption{مطالعه}
\label{fig:1-1}
\end{figure}
\end{document}